Bring Vision to Life with Three Horizons, Data Mesh, Data Lakehouse, and Azure Cloud Scale Analytics
Check out this past post from the Microsoft Data Architecture Blog in May 2022
Introduction:
Many of you may have been focused on analytics for years and have shown audacity, acumen, and determination in improving your decision-making and the decisions of those around you. You have personified Teddy Roosevelt’s “the person in the arena” as opposed to sitting on the sidelines and watching. Whether you have been in the arena, are new to the space, or can’t wait to get on the field, I hope this will inspire thought, discussion, debate, and action.
There’s always been organizational, architectural, and technical blockers to successfully building, deploying, maintaining, and using analytical systems. I have experienced many of these firsthand as an implementer and user since I wrote my first SQL statement back in 1993. So much has changed in the last 29 years, but so much has also stayed the same. We are still getting, preparing, modeling, analyzing, and visualizing data regardless of role (Data Analyst, Data Scientist, Data Engineer, Data Consumer) and tools (BI, AI/ML, Pipelines/Notebooks, Report/Dashboards) used. It’s now just with more diverse personnel using more affordable, intuitive, and scalable tools than in past decades. I am going to consider analytical system architecture from a strategic, organizational, architectural, and technical point of view.
Modeling an organization’s strategic vision for the future requires changing the organization in incremental, evolutionary, and revolutionary ways. Analytics is an important catalyst for change, innovation, and transformation. People using analytical tools can help the organization make better data-driven decisions that support the transition from where an organization sits today to somewhere on and beyond the horizon. Getting started involves tactical assessment of the current state (As-Is) architecture, and discussion and prioritization to define the future state (To-Be) architecture. These first steps can lead to prioritizing which systems should receive operational enhancements initially, and what data, tools, and processes should be used to drive innovation. Essentially transforming complex systems is part of strategy and you need a strategy to vision cast to hook others to move towards the destination. I think that the Data Mesh and Data Lakehouse approaches could help tactically drive change and realize vision.
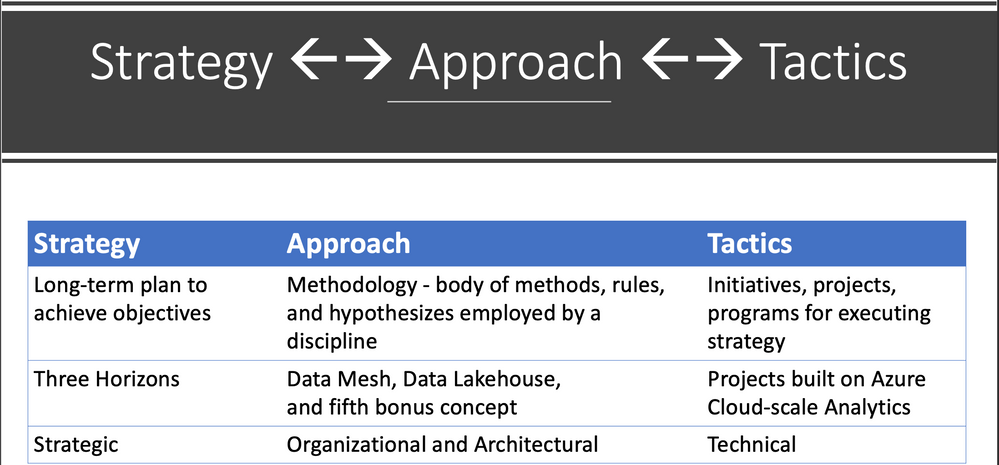
The methodology I propose to explore and start down the path towards realization of this analytic strategic vision is through the composition of these concepts:
- Three Horizon Model/Framework – strategic
- Data Mesh Sociotechnical Paradigm – organizational
- Data Lakehouse Architecture - architectural
- Azure Cloud Scale Analytics Platform – technological
Exploration:
Like exploratory data analysis (EDA) performed on a dataset, I decided to spend some time exploring these concepts during a recent 7-day camping trip to Salt Creek Recreation Area near Port Angeles, WA.

I recommend staying in this beautiful setting with small islands, tidal pools, trees, bald eagles, and snowcapped mountains.
By the time I reached the midpoint of camping I felt great about Data Mesh and Data Lakehouse. I had been coming to the conclusion about the better together synergies for a while, and the more I read Data Mesh by Zhamak Dehghani (Data Mesh founder – Thoughtworks) the more it appeared that Data Mesh and Data Lakehouse need each other. Watching Matei Zaharia’s (Chief Technologist & Cofounder – Databricks) YouTube video Data Mesh and Lakehouse solidified this point further.
Three Horizons Model
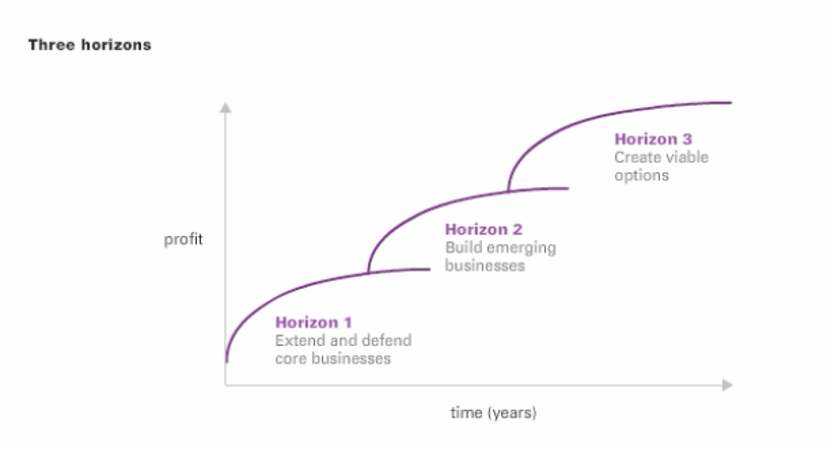
I have been reading about the McKinsey Three Horizons model introduced in the book The Alchemy of Growth - Practical Insights for Building the Enduring Enterprise by Authors Mehrdad Baghai, Stephen Coley and David White. Three Horizons, like analytics, has been seasoned over multiple decades. This strategy-focused methodology appears promising to help align stakeholders from the business (management and leadership outside of Information Technology). Helping them envision, embrace, and invest in innovation and transformation.
Looking at the diagram below from McKinsey’s Enduring Ideas: The three horizons of growth you can get an idea of how an organization can drive business value creation (growth and profit) over time by reaching: Horizon 1 - improving performance of existing core businesses, Horizon 2 - building new emerging businesses, and Horizon 3 - creating viable new options through research projects or pilot programs.
Here is a similar diagram in the context of operational and analytical systems related to cloud maturity and accumulated total returns.
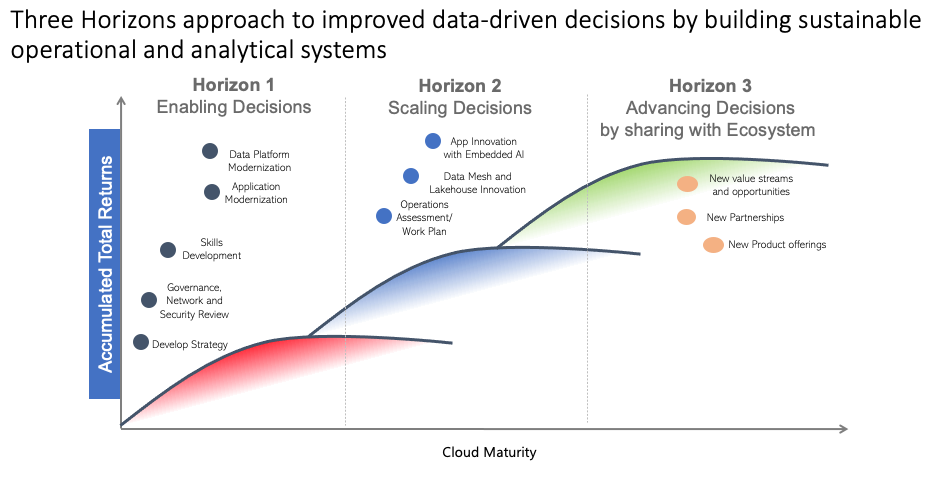
This diagram is another view of 3 Horizons that illustrates H1 operational enhancements to existing business systems and its importance to setting up H2 innovation and H3 transformation possibilities.
The reason I like the 3 Horizons model is that strategy is important to the leadership in companies and the support of leadership is essential for architecting analytical systems. Every successful project or program needs some sustained BANTR – Budget, Authority, Need, Timing, and Resources (not the Ted Lasso fictional dating app). As we move to looking at Data Mesh you can see that some strategic vision is going to be applied because it will require a new approach to how teams are organized, and what the team’s priorities are. A similar shift has already taken place with the distribution and scaling of operational systems that use microservices, domain-based teams (2 pizza teams – small enough that they can be fed with two extra-large pizzas), and distributed architectures enabled by containers and orchestrators like Kubernetes.
Data Mesh
As defined in the book Data Mesh by Zhamak Dehghani, Data Mesh is a socio-technical paradigm based on four principles:
- Principle of Domain Ownership - decentralization and distribution of data responsibility to people who are closest to the data
- Principle of Data as a Product - the analytical data provided by the domains is treated as a product, and the consumers of that data should be treated as customer
- Principal of the Self-serve Data Platform - self-serve data platform services that empower domains’ cross-functional teams to share data
- Principal of Federated Computational Governance - a decision-making model led by the federation of domain data product owners and data platform product owners, with autonomy and domain-local decision-making power, while creating and adhering to a set of global rules
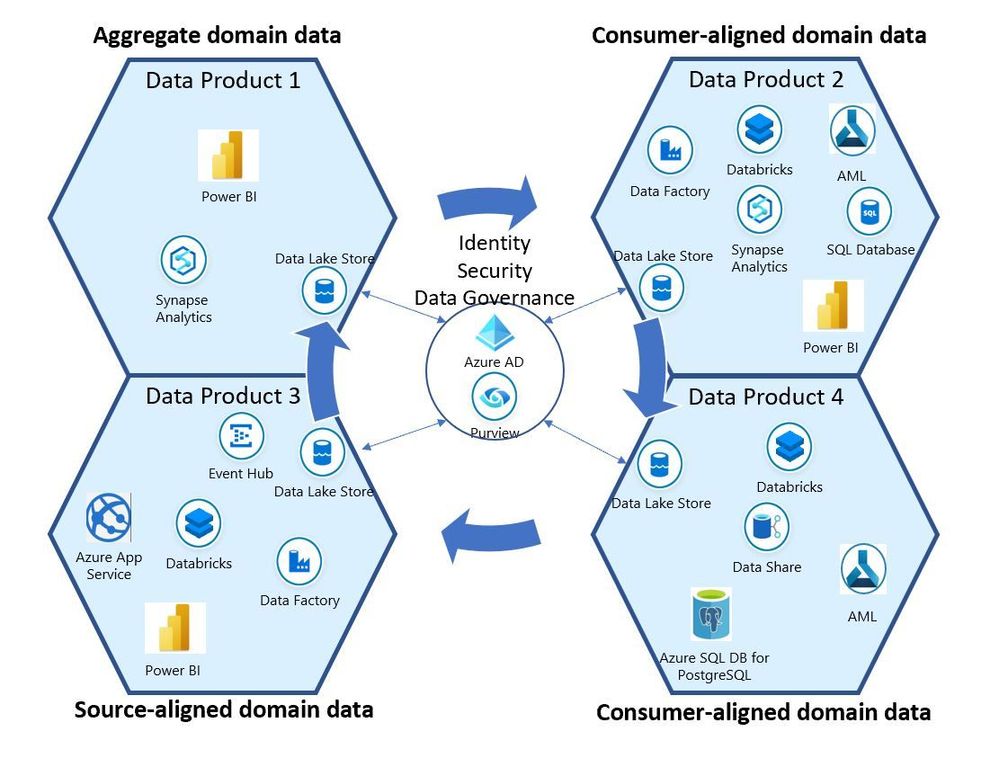
The Domains make data products out of domain data that can be Source-aligned domain data (the facts and reality of the business), Aggregate domain data (long-standing aggregate data composed from multiple source-aligned domains), or Consumer-aligned domain data (the applications that consume the data, or data users such as data scientists or analysts).
With Data Mesh you organize teams in a distributed way by Domain (focus on Business or Activity being supported) vs centralized teams of Data Warehouse specialists for analytics. In my way of thinking if you are going to build Data Lakehouse’s we need more skilled resources. The construction business scales to meet the demand for building and maintaining structures, so why shouldn’t analytics scale to do the same with data structures. The Data Mesh approach can help with the bottlenecks of centralized organizational structures and centralized technical architectures. Data Mesh could also limit the power struggles where the Data Warehouse team is the only standard that bullies everyone else around, blocks entry into the Data Warehouse, or throttles query access when you want to get data out. If a group wants to share data let them get some cloud-based storage and compute, and not be blocked by another group. Proprietary storage and table formats along with limited tools for query access (just SQL) are the legacy of on-premises MPP Data Warehousing appliances. Cloud-based Data Warehouses have changed this dynamic but the organizational structure and technological consolidation into one place approach still may be far from distributed. Not because it could not be but because the team and/or organization wants it to be that way.
Data Mesh Domains have the same team responsible for the operational (OLTP) system and the analytical (OLAP) system. Synapse Link HTAP (Hybrid Transaction/Analytical Processing) has features for Cosmos DB and Azure SQL Database. For teams that are responsible for Source-aligned domain data in the Data Mesh world, Synapse Link HTAP could be an approach.
When it comes to self-serve data platforms, I think that tools like Power BI have done a great job of providing self-service for Data consumers and Data Analysts. Databricks and Synapse Notebooks, and Data Factory and Synapse Pipelines or Databricks Delta Live Tables are great tools for Data Engineers. Also Databricks Notebooks, Azure Machine Learning Notebooks, and AutoML have Data Scientists covered.
When it comes to Data Governance, Data Officers must go on both offense to increase access to data, and on defense to protect data. Tools like M365 Information Protection, Power BI Sensitivity Labels, and Azure Purview access policy seem to help with the Governance principle.
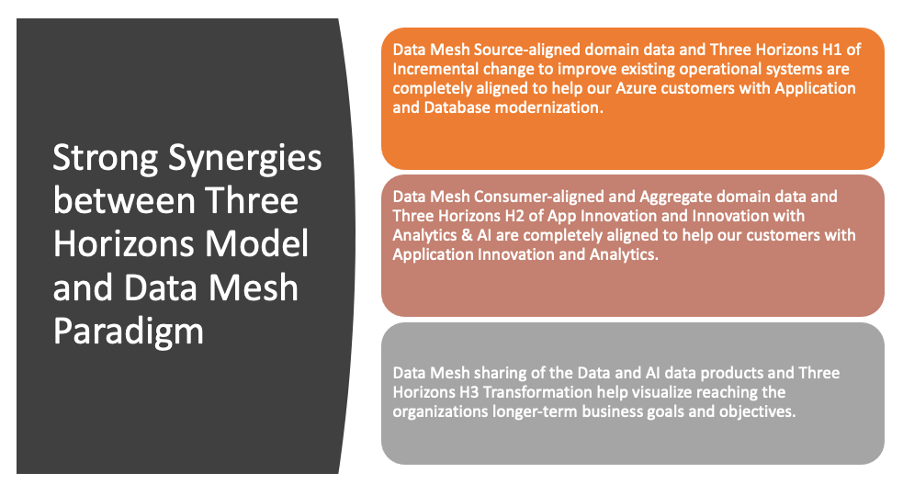
I really see strong synergies between the Three Horizons Model and the Data Mesh Paradigm
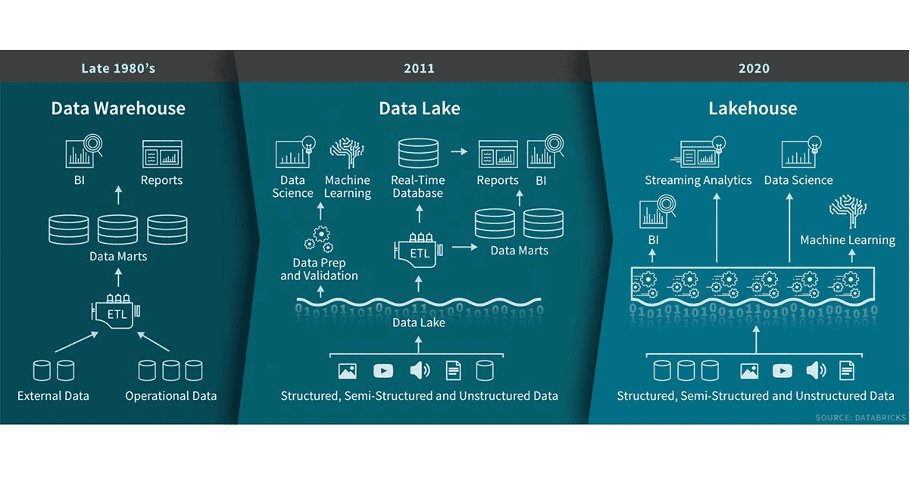
Data Lakehouse Architecture
thumbnail image 8 of blog post titled Bring Vision to Life with Three Horizons, Data Mesh, Data Lakehouse, and Azure Cloud Scale Analytics
What is a Lakehouse? - The Databricks Blog
A Data Lakehouse is a new, open architecture that combines the best elements of data lakes and data warehouses.
Some of the characteristics of a Lakehouse include the use of:
* Low-cost Object Storage (like ADLS) decoupled from compute
* Batch and Stream processing
* Diverse Workloads
    * Data science
    * AI and Machine learning
    * BI, SQL and analytics
* Diverse and open data formats and diverse data typed
    * File formats: Avro, CSV, Json, ORC, Parquet
    * Table formats: Delta, Hudi, Iceberg, Hive Acid
    * Tables, images, video, audio, semi-structured data, and text.
* Metadata Layers
    * ACID Transactions
    * Versioning and Time travel
    * Governance
* Diverse Engines, Tools, and Languages
    * Presto, Dremel, RDBMS External tables
    * Great SQL performance with Photon engine
    * PySpark, Scala, Java language support
    * Jupyter, Tensorflow tool support
* Sharing and governance
    * Delta Sharing
    * Unity Catalog
    * Schema enforcement
Data Mesh and Data Lakehouse better together
IMO Data Mesh using a Data Lakehouse Architecture, built on Azure Data & AI and Data Governance Services can really help organizations. I see domain-driven design foundation of Data Mesh and the data-driven decisions enabled by Data Lakehouse as a great one-two punch.

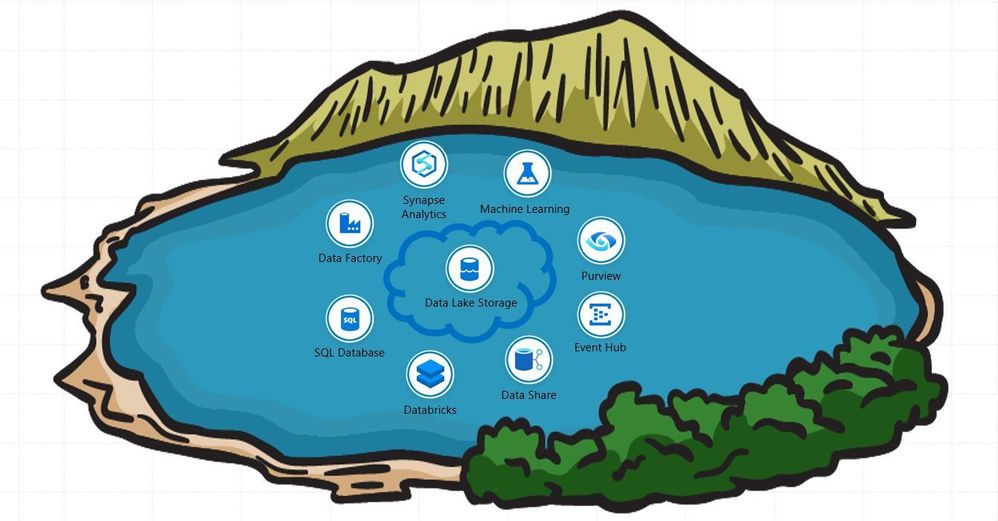
Azure Cloud Scale Analytics
Microsoft Azure has accelerated analytics at a faster rate than I experienced in the first 20 years of my career. Cloud competition has become a space race that accelerates transformation. When building a Cloud Scale Analytics architecture to define, model, and reach an organization’s strategic horizons, architects must consider everything from how teams are organized (see Data Mesh) to how to simplify and unify operational and analytical data systems (see Data Lakehouse, Synapse Link HTAP).
Azure is a great Cloud Scale Platform for architecting Analytical Systems. It includes Azure Data Lake Storage (ADLS) object storage, Azure Data Factory batch and Event Hub, Azure Databricks and Azure Synapse Spark pool streaming pipelines for data engineering. Data Science AI and Machine Learning tools in Azure Machine Learning, Azure Databricks, and Azure Synapse. Data Management capabilities in ADLS, Azure Databricks, and Azure Synapse SQL and Spark pools. Data Analyst tools in Power BI and Excel.
The following image shows some examples of various cloud services that could be used by teams representing Consumer-aligned, Aggregate, and Consumer-aligned data domains. These domains could be governed by Azure Purview and Azure Active Directory in support of access policy and discovery and classification of data existing in the organization.
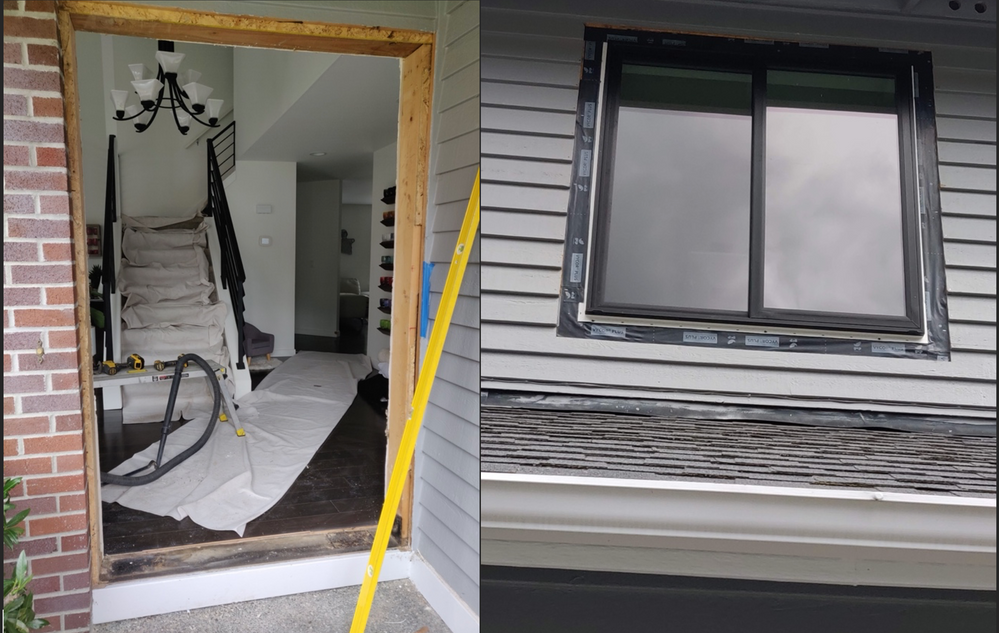
Balancing Current Realities - But just a minute:
The week after camping I was back to the realities of work and the challenges of modernizing an existing house. It is not a Lakehouse or a Warehouse, but a residential house. We were getting new windows and exterior doors which needed replacing on the 30-year-old structure. I am thinking pragmatically here because most organizations might be working with legacy systems for operational and analytical data that could be more than decades old. To balance my fondness for Data Mesh and Data Lakehouse (two new shiny objects) I need to measure them against the analytics concepts that have come before. Data Mesh and Data Lakehouse are still relatively new. Therefore, I am going to balance my hope for the To-Be future of analytical system architectures with the reality of keeping the lights on with the current As-Is analytical system architectures. As a result, I will discuss another concept, Data Fabric, which is also a new emerging trend. Data mesh is going to play nice with new operational systems based on microservices and distributed event streaming, but how will it do with Legacy monolithic on premises apps? Tactically what projects are candidates for Data Mesh and Data Lakehouse, versus what should left alone and use alternative ways to integrate?
Keep the lights on and leverage what an organization already has – Modernize the House
Bonus concepts:
What about Legacy Analytics and keeping the lights on – Use Data Fabric
IMO Data Fabric is an umbrella term that covers some emerging technology, as well as some existing seasoned technologies that has been around decades before Data Mesh and Data Lakehouse. Initially some of the data virtualization technologies previously known as Enterprise Information Integration (EII) have been marketed as logical analytics systems that don’t move or copy data from sources but get it from sources without using ETL and Data Warehousing - an alternative approach.
According to Gartner data fabric is a design concept which requires multiple data management technologies to work with the aim of supporting “frictionless access and sharing of data in a distributed network environment”. I have also seen Data Fabric described as modernizing existing investments like databases, data warehouses, data lakes, data catalogs, and data integration platforms.
Data Fabric helps make data the fabric of our lives. For me Data Fabric is at least three things:
- New naming of data management technologies that have been available in some cases for 2 or more decades: BI, ETL, OLAP/In-memory, Data Virtualization, Replication, Change Data Capture (CDC)
- Newer emerging data management technologies like Data Sharing, Distributed event streaming, Distributed query engines like Spark, Presto and Dremel; and External table access to files using RDBMS systems
- Some newer AI enabled features and catalogs that are showing up as new vendor features
The first Decision Support Systems (DSS) or BI tools I used had pipelines (Metaphor capsules), and sematic layers (Metaphor, Brio, Business Objects) and OLAP databases (Essbase, Analysis Services). These tools (as Power BI and Tableau are today) were sold as solutions that could work with or instead of data warehouses. Business Objects semantic layers (universes) could be created on top of OLTP database schema, an Operational Data Store (ODS), or star (ROLAP) schemas from Data Marts or Enterprise Data Warehouses (EDW). Sales, marketing, and finance are examples of departments that were not going to wait for the EDW to be built.
In the case of Metaphor it was marketed as an Executive Information System (EIS), but it looked like an ETL tool that could run pipelines on demand. Data preparation/ETL tools could bring data into Lotus or Excel, like the way Power Query does today in Excel.
CDC and Replication tools were used to create an ODS that was used as data hubs for integration and sources for Reporting. Early EII tools like Nimble Technology were acquired by reporting tools like Actuate to become it’s semantic layer.
Emerging examples of Data Fabric include Data Sharing like Databricks Delta Sharing, Snowflake Secure Data Sharing, and Azure Data Share. Distributed query engines like Spark, Presto and Dremel are examples of Data Fabric that can make Data Lakehouse and Data Mesh work.
External tables on RDBMS systems like Azure Synapse Analytics Serverless or Dedicated pools can be used for Lakehouse and Data Warehouse queries or for loading DW tables, and Azure SQL Managed Instance can query open file formats like Parquet.
Examples of Data Fabric/Data Virtualization Types (Not exhaustive list and my Opinion):
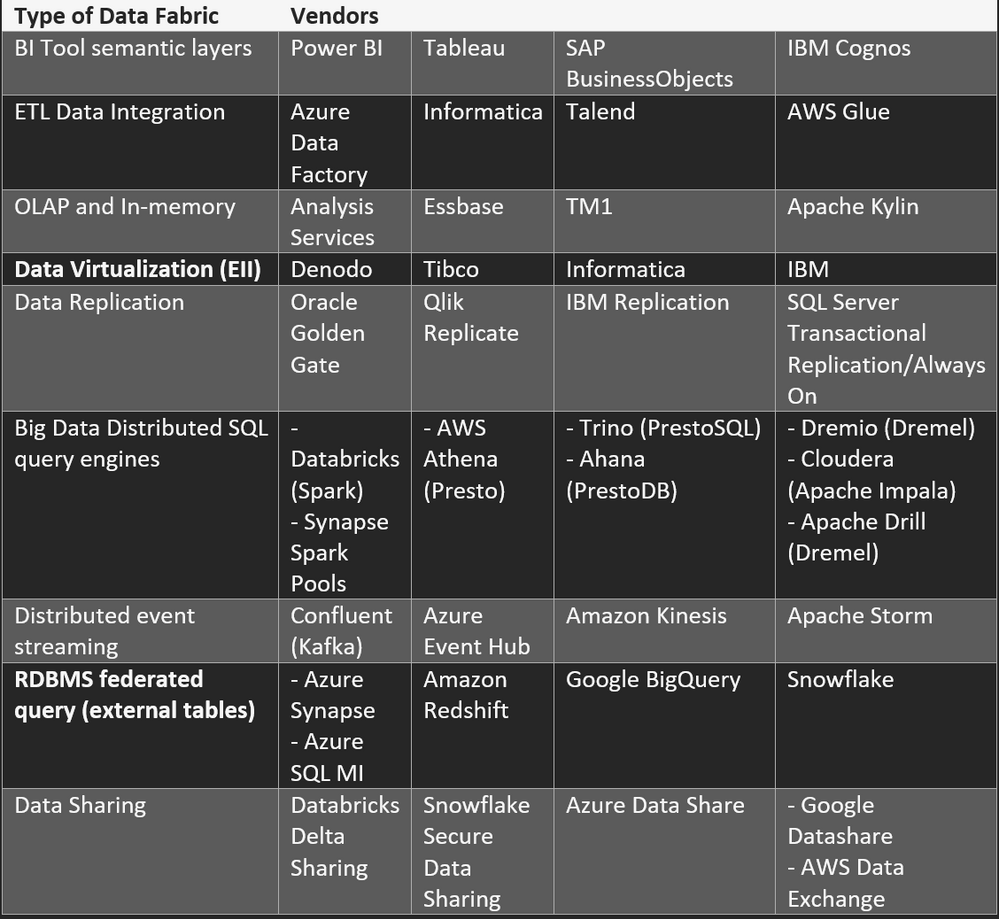
Except for Data Replication (which maintains the source schema) and Distributed Event Processing (which has a schema registry) most of the items in the table above create a data layer on top of data sources that allows for the integration of data. The reason I have included Data Replication and Distributed Event Processing in the table is because these are practical ways of getting data out of the operational systems into changing copies that data layers can be created on top of. I am not sure that practical coping of data can be avoided when it comes to integration, security, and retrieval of data. There is always going to be a copy whether it be a replicated transactional database, events set to multiple places by a distributed event processing system like Kafka, a landing zone for files that are processed and rewritten, or a BI tool with data cached in an in-memory database that is refreshed on a BI service like Power BI.
Improving access to data by consumer-aligned custom applications, data scientists, data analysts, and data consumers justifies the copies. The data product needs consumers.
IMO Data Mesh and Data Lakehouse make better To-Be data sources for Data Fabric technologies because much of the logic is built into the outputs vs just pointing to the original sources. Find the right use case, business process, or domain and build your own Data Mesh, Data Lakehouse, and Data Fabric with today’s As-Is tools as the To-Be market evolves. Prioritize business critical operational systems and modernize those operational systems with unification to analytical systems as part of the design.
An aside about Data Marts vs Data Warehouses
What is appealing to me about Data Mesh and Data Lakehouse is that it is distributed. I have always been a distributed fan. I was a Ralph Kimball follower, and data mart practitioner who started building data marts in 1996. The tooling has always been the same for data marts and data warehouses (Data Integration - ETL/ELT, Relational Database, BI Tool), but the philosophy was different – data marts where bottom-up and had some department autonomy vs enterprise data warehouses were top down and centralized. Data marts were on a central RDBMS to combine the data needed for the business process, but they were still distributed. Microsoft SQL Server 7.0 and future versions were great places to build data marts. The challenge with data marts was that you could not fit all the fact tables on a single RDBMS and not every group would use the same database vendor for their data mart. BI and data integration tools could glue it all together, but it was siloed.
Initially the goal was to deliver data marts in 90 days, but this did not scale because:
- Data Marts never scaled the teams up or out to additional teams
- After delivering a couple of Data Marts the team could fail under the technical debt of maintaining the existing Data Marts so they couldn’t also create new ones
- The more that were built the higher the complexity got
- Data Mart teams had no authority over the source applications, so they continually needed to fix data quality that was never fixed upstream in the source system
Did data marts fail because they were distributed? Or did they fail because the architecture was monolithic? Did they fail, or did BI tools consume the approach and just do more of what the data mart did like data integration, data modeling, data storage, and data access?
I think the centralized attitudes in Data Warehousing was one of the reasons that Data teams stayed small and specialized as controlled communities. If you believe in one version of the truth you keep the community small. If you accept the ambiguity that exists in life you let more people participate - it can’t be centralized. All the spread-marts, Microsoft Access databases, Budgeting and Planning OLAP Cubes, SQL Server Data Marts, Analysis Services Cubes, and Reporting Services, Brio, Business Objects, Cognos, Microstrategy, Nquire (OBIEE), Tableau, Power Pivot, and Power BI assets have happened regardless of whether a Data Warehouse existed or not. Will the concepts of Data Mesh and Data Lakehouse fully staffed become the domain data sources that Data Marts and Data Warehouses had mixed success achieving.
Customer Scenarios
Couple customers scenarios I have recently seen that are reasons to think about distributed vs centralized approaches:
-
Not treating Data as a Product: The IT Pros responsible for the analytical source-aligned domain data are apprehensive to improve the integration into operational data stores (ODS) and don’t see the aggregate domain data team as a customer.
-
Not defining Domain Ownership: IT Leadership are eager to expand to an enterprise data warehouse focus despite the Institutional Research (IR) team’s wants and needs to get going on a project that is more data mart worthy. The team must take on the burden and technical debt of a centralized approach.
The first scenario needs the Data Mesh and Data Lakehouse approach to restore the trust between the IT team and the analytics team. IT needs to create some SADD teams that are more responsive to changes to the source systems, so the analytics team can be an ADD team.
The second scenario needs the Data Mesh and Data Lakehouse approach because the centralized approach is not going to make anyone happy, may take too long, and be too expensive (can’t distribute the costs). IT Leadership needs to build SADD Data Mart, Data Warehouse, or Data Lakehouse so the IR team can become an ADD Data Mart or Data Lakehouse. IR does not need to be a Data Warehouse.
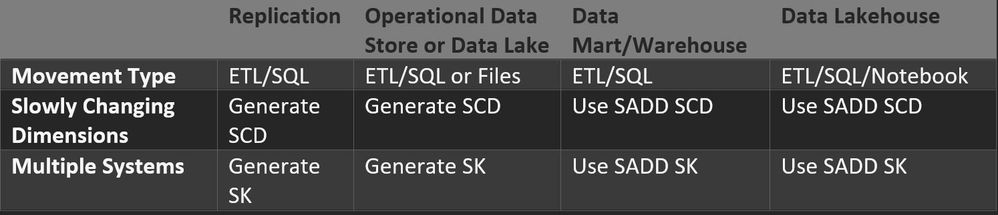
The following tables show some of the options a Source-aligned Domain Data (SADD) team can use to provide Data Products, and what an Aggregate Domain Data (ADD) team would need to do based on what the SADD team provided. A Consumer-aligned Domain Data (CADD) team could get data from either the SADD or ADD. I would say that the replication and Operational Data Store (ODS) or Data Lake are the most common ways that data sources are provided for analytics currently. It would be the exception currently that a SADD team would provide Data Mart, Data Warehouse, or Data Lakehouse functionality to potential ADD teams.
Source-aligned Domain Data (SADD) Product Options
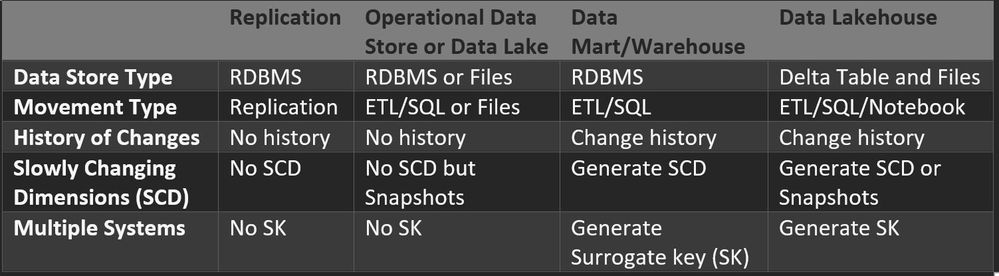
Aggregate Domain Data (ADD) Sources Options
Consumer-aligned Domain Data (CADD)
Apps that consume the data or data users such as Data Scientists, Data Analysts, or Data Consumers. Using queries, notebooks, custom apps, portals, reports, dashboards.
Get data from the most mature ADD or SADD product. The least mature product would be SADD Replication, and the most mature would be ADD Data Lakehouse. I am categorizing Data Lakehouse as more mature than Data Mart or Data Warehouse because the user could query across multiple SADD or ADD Data Lakehouse tables using a query spanning multiple Delta Tables (Colocation important to make this practical).
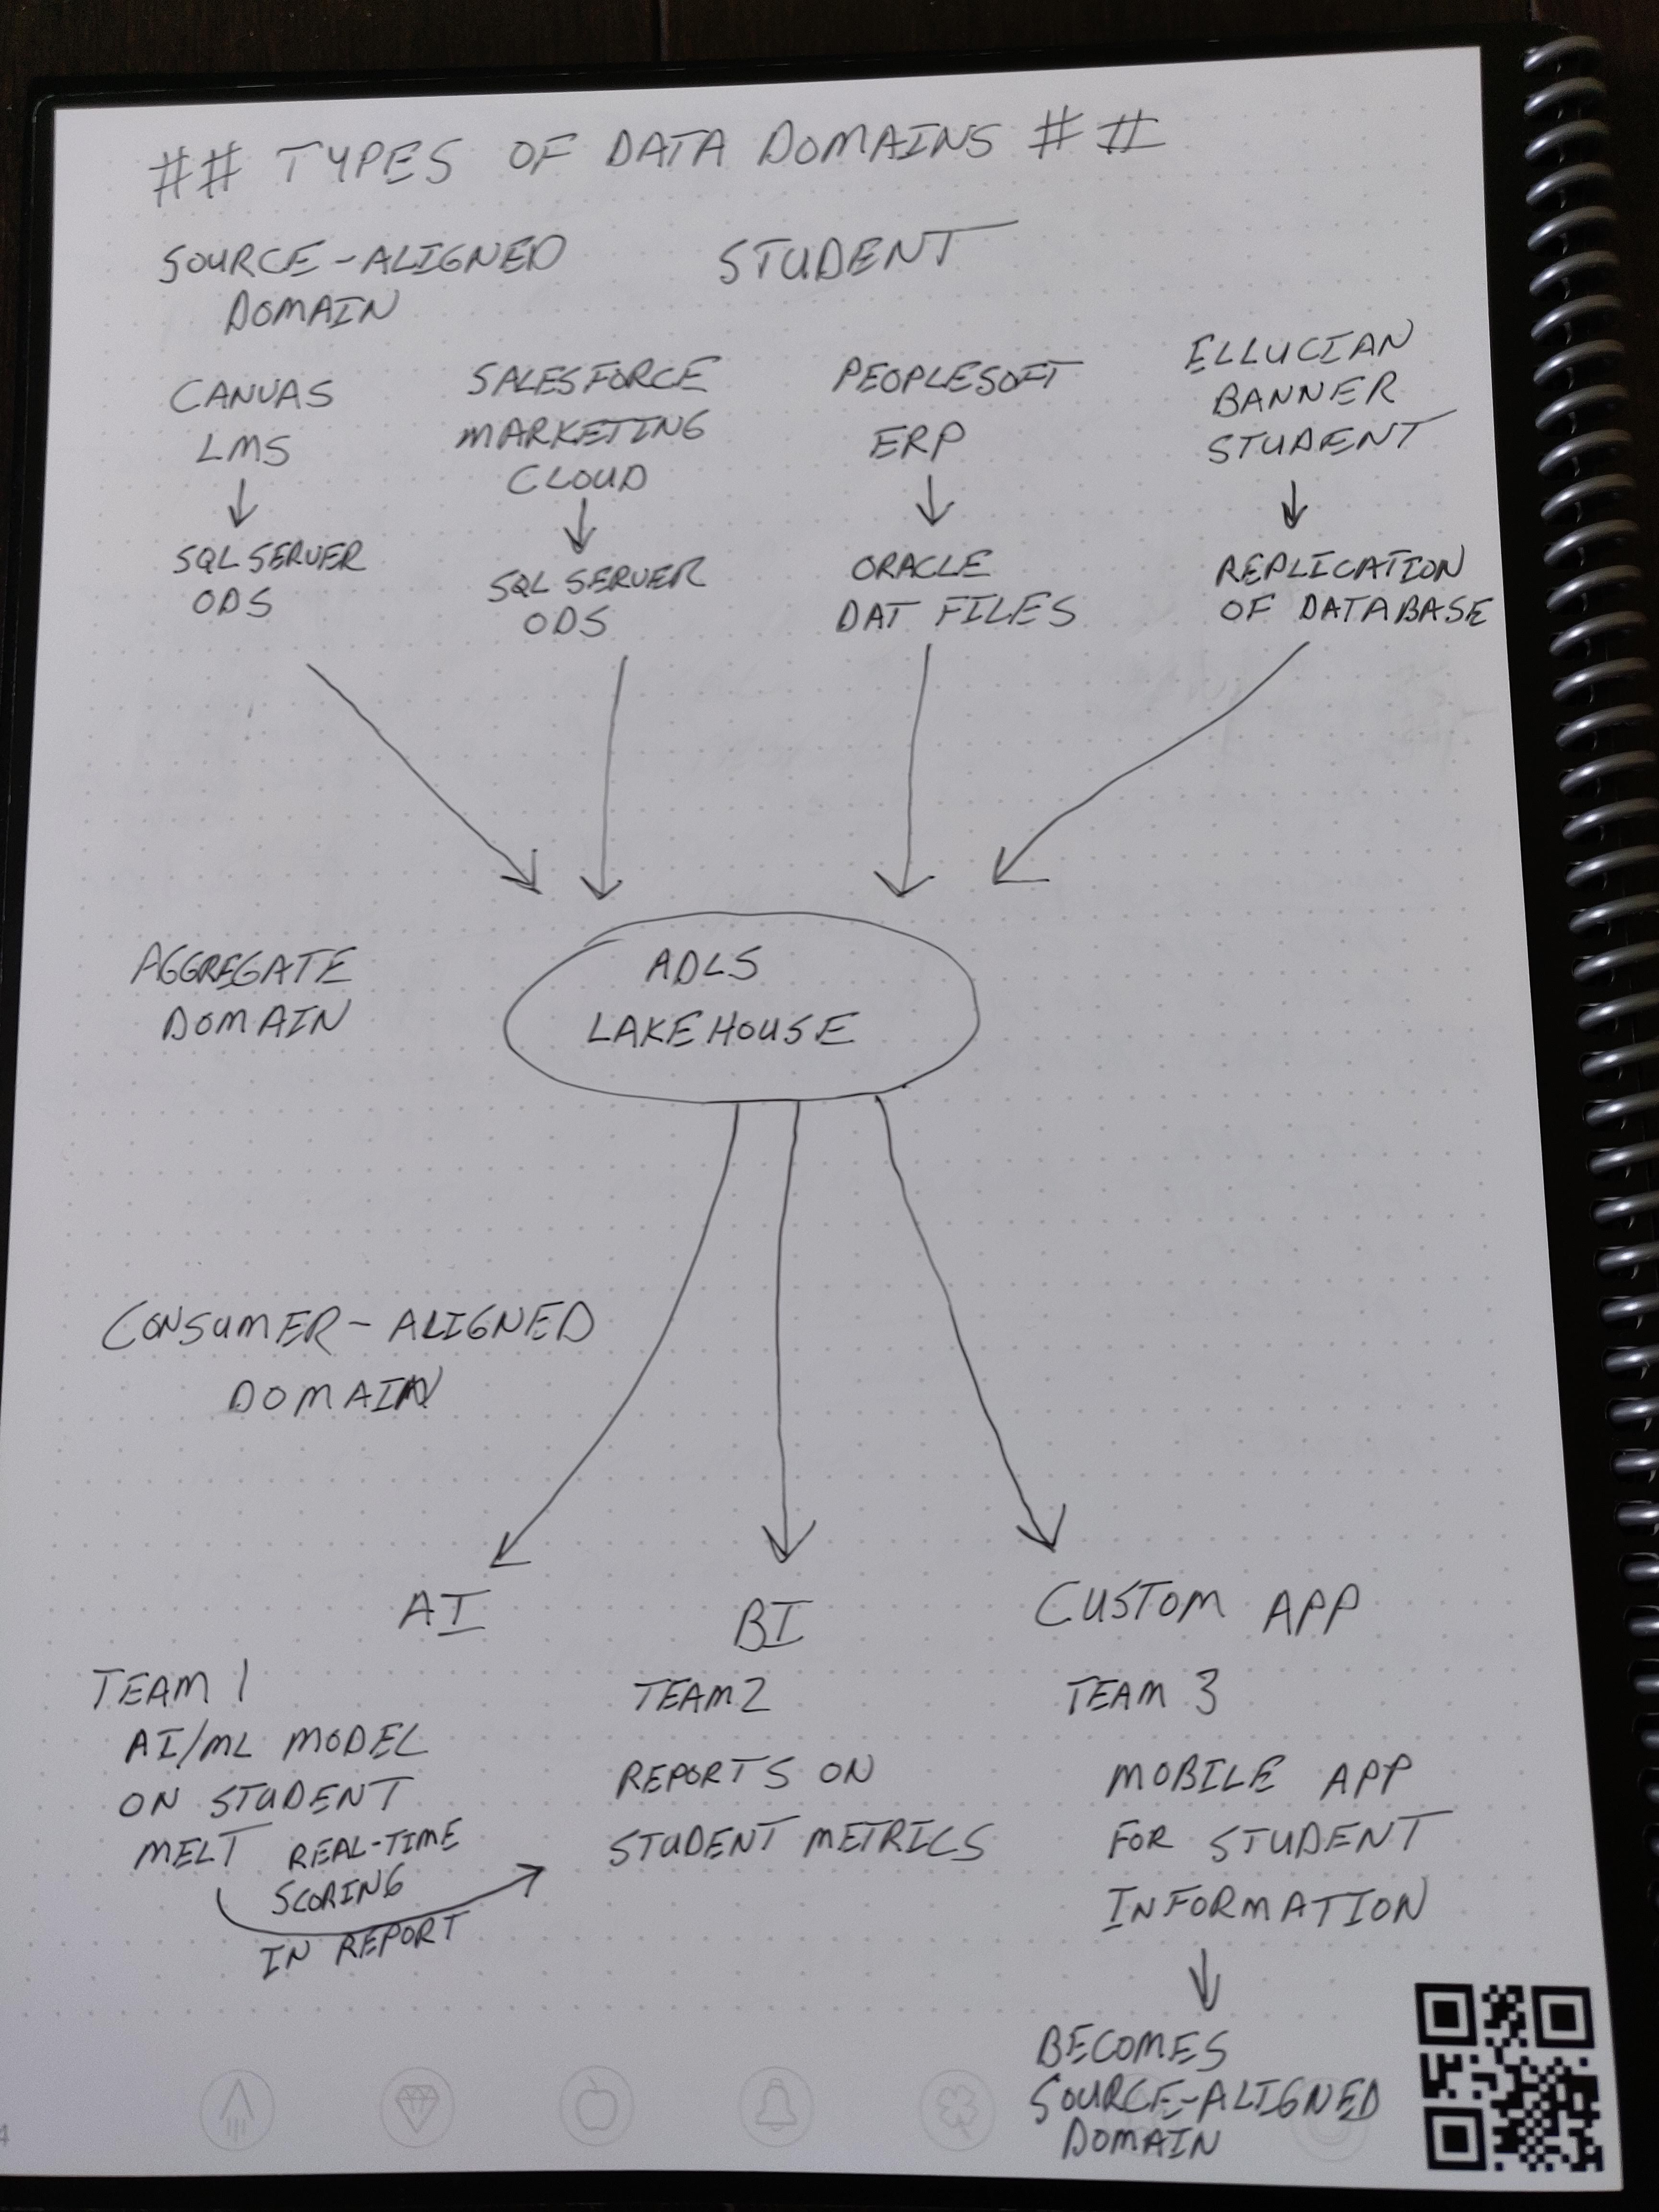
The drawing above only depicts the Data Lakehouse as storage leaving out the fact that compute would be needed to move data out of the data sources and do the data processing required to transform the data (by perhaps a data engineer in the aggregate domain). The data consumers in the consumer-aligned domain would also need compute to get data out of the Data Lakehouse but they could do this in a serverless way vs needing to pay to persist the data.
This really seems like a decent way of sharing the costs of usage to the teams that are doing the work creating their data product. If the economics of cost to value don’t workout then that group can adjust their usage appropriately.
Roles involved, and tools and processes
Here I would like to look at the Data Analyst, Data Scientist, Data Engineer, and Data Consumer roles and the tools they might use and the process they might follow. I general the Data Consumer uses artifacts created by the 3 other roles. The other 3 roles all follow similar processes and could use similar tools. The Data Analysts and Data Scientists can leverage work done by the Data Engineer or go do their own data processing. This is where the friction exists between distributed autonomy and distributed teams. The better the SADD and ADD team the less likely the CADD team or individual is to go do data processing themselves.
The diagram from the O’Reilly report “Implementing a Smart Data Platform” shows the closed loop steps of data processing. My premise is that a data analyst can perform the steps in Power BI, the data scientist can do much of this in a Jupyter notebook, and the data engineer can use pipelines and Spark notebooks that augment the efforts of the other two roles.
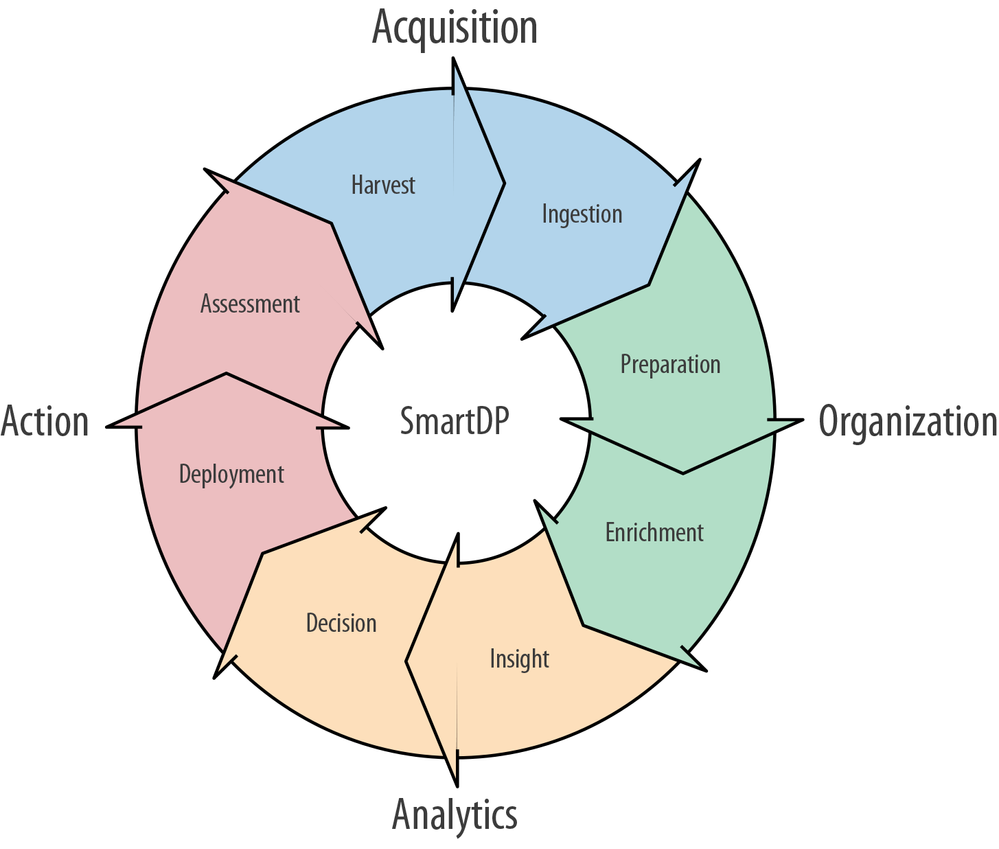
Closed loop of data processing (figure courtesy of Wenfeng Xiao) from the O’Reilly report “Implementing a Smart Data Platform”
Concluding Thoughts:
This brings me to my back issue. I was not sure whether to ice it, use a heating pad, take anti-inflammatories, stretch, lie flat on my back. While looking for ideas I found out that the advice for treating soft-tissue injuries had changed. Rice had moved to Police, and then on to Peace and Love.
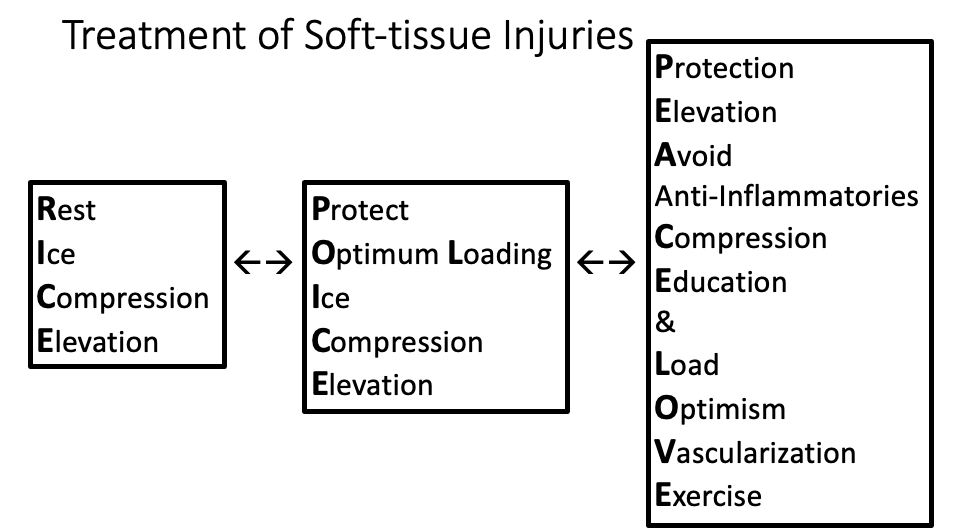
The P.O.L.I.C.E. Principle Emergency Treatment for Acute Injuries
Soft-tissue injuries simply need PEACE and LOVE
The basic metaphor here is that things change.
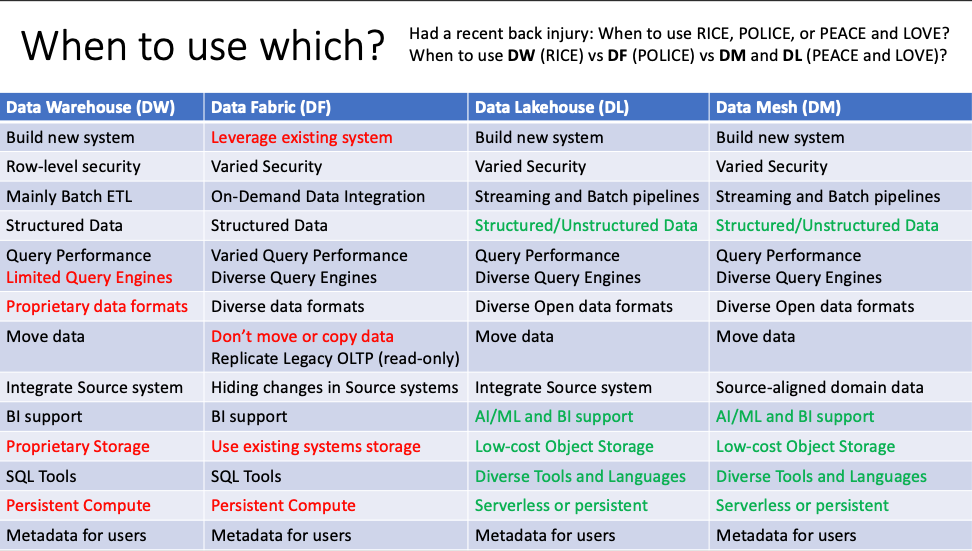
When to use DW (RICE) vs DF (POLICE) vs DM and DL (PEACE and LOVE)?
Below is a recent slide I used in a recent presentation. I see some definite advantages for Data Mesh and Data Lakehouse related to diverse data types, AI/ML and BI Support, the use of low-cost object storage, diverse tools and languages, and options for both serverless and persistent compute. For Data Warehouse you many have the query engine of the DW service itself, the data may be in a proprietary data format (but it could map to open formats as external tables), might use proprietary storage (although may use low-cost object storage), and the compute may be persistent (although it could be paused or scaled as needed). For my broad definition of Data Fabric it can leverage existing systems which could lead to performance issues on the source system requiring at least replication of the database, I am not convinced that don’t move or copy the data is realistic, or the use of the existing systems storage would work and that the storage and caching of data would need persistent compute. I am much more sure of data layers for BI semantic layers than I am of data layers for integration that are not persisted by a copy in OLAP/In-memory, Data Mart, Data Warehouse, or Data Lakehouse. This is definitely getting more blurred with Query engines on top or Parquet or Delta tables, but someone did a bunch of work to create those file and table formats ahead of time and the data was copied.
Guidance
Do you put new windows in the old house or move to a Lakehouse?
- Data Warehouse, Data Fabric, Data Mesh, and Data Lakehouse can be complementary but also compete based on ideology/belief
- If you need RDBMS familiar features like Row-level security, use Data Warehouse or OLAP/In-memory Data Fabric
- For existing Analytics architectures, use Data Fabric to connect, compose, and consume what you already have and selectively migrate priority Source-aligned domain data to Data Mesh and Data Lakehouse, because rip and replace is expensive
- For new (green field) Cloud Scale Analytics projects, use Data Lakehouse and Data Mesh (DL and DM work well together) To Be your new doors and windows; then see if the neighbors with the 30-year-old houses follow suit.
- Remember technical debt requires scaling workers (code development, modification, and maintenance) and is a bigger lock-in than vendor lock-in
- More people and more talent development when capital is decentralized. Less bureaucracy, more staffing, less expert bias, and a little friendly competition (new windows)
- Building organizational and technical maturity takes time and participation
- Recognize the existing politics between OLTP and Analytics (OLAP) software developers on which is priority
- Milk Carton Rule: “Instead of dwelling on what you can’t change, focus on what you can.” This includes others views of centralized and distributed.
- Like Waterfall to Agile, centralized Data Warehouse to distributed Data Mesh with Data Lakehouse is going to take some time for adoption and transformation
IMO Azure Synapse Guidance for DW, DM, and DL
- When using Synapse Dedicated MPP pool use the RDBMS as a High-Performance Query endpoint not an ELT tool
- For Data Integration leverage Pipelines, Spark pools, and Spark Notebooks for ETL/ELT on ADLS using Parquet/Delta
- For Power BI in import mode refresh datasets using Lakehouse and Serverless SQL and for direct query mode use Dedicated pool
- For telemetry captured in Azure use Data Explorer (Kusto), for example data collected by Azure Application Insights or Azure Monitor
- For teams that are responsible for Source-aligned domain data, consider Synapse Link HTAP (Hybrid Transaction/Analytical Processing) for Apps backed by Cosmos DB and Azure SQL Database
- For streaming applications delivering data using Kafka, Event Hub, or IoT Hub consider using Spark Structured Streaming in Azure Databricks, or Azure Synapse Spark pools. Captured data in ADLS container can be queried in Spark, Synapse Serverless SQL, or Azure Databricks SQL endpoints.
- For AI/ML needs use Lakehouse and Spark (Databricks or Synapse Spark pools and Notebooks) and/or Azure ML and Cognitive Services
Last week as I sat in the Building 34 Café on the Redmond campus between my Chiropractic and Acupuncture appointments I feel like my back issue is actually improving. Sometimes it takes multiple disciplines (Chiropractic, Acupuncture, Physical Therapy, Pharmacology) and modalities to diagnose, treat, rehabilitate, and prevent an injury. I think medical professionals make decisions just like decision makers in other domains.
Hopefully this post can help your organization justify investment in analytics and exploration of some of these concepts discussed to break the pain-spasm cycle that exists between the spread-mart wild wild west and the locked down Enterprise Data Warehouse! Please let me know how you feel about my depiction of Three Horizons, Data Mesh, Data Lakehouse, Cloud Scale Analytics, Data Fabric, Data Marts, and Data Warehouse; the customer scenarios, roles involved, and tools and processes used to architect them.
If you have not categorized me yet, I am a distributed data marts, data mesh, and data lakehouse fan that would surround these concepts with distributed AI/ML, BI, and Custom Apps.
Gazing over the horizon, the improved view will “Bring Vision to Life”!

Links to Data Mesh, Data Lakehouse, Data Fabric, and Azure Resources
Unlocked: Cloud Scale Analytics slides
Unlocked: Cloud Scale Analytics video
Cloud-scale analytics - Microsoft Cloud Adoption Framework for Azure - Cloud Adoption Framework